Stop Chasing Top Line, Airbnb Owner Reporting Metrics That Matter
Learn Airbnb owner reporting metrics that reveal true performance, from ADR and RevPAR to net after fees and dashboard red flags. Built for Nashville investors.
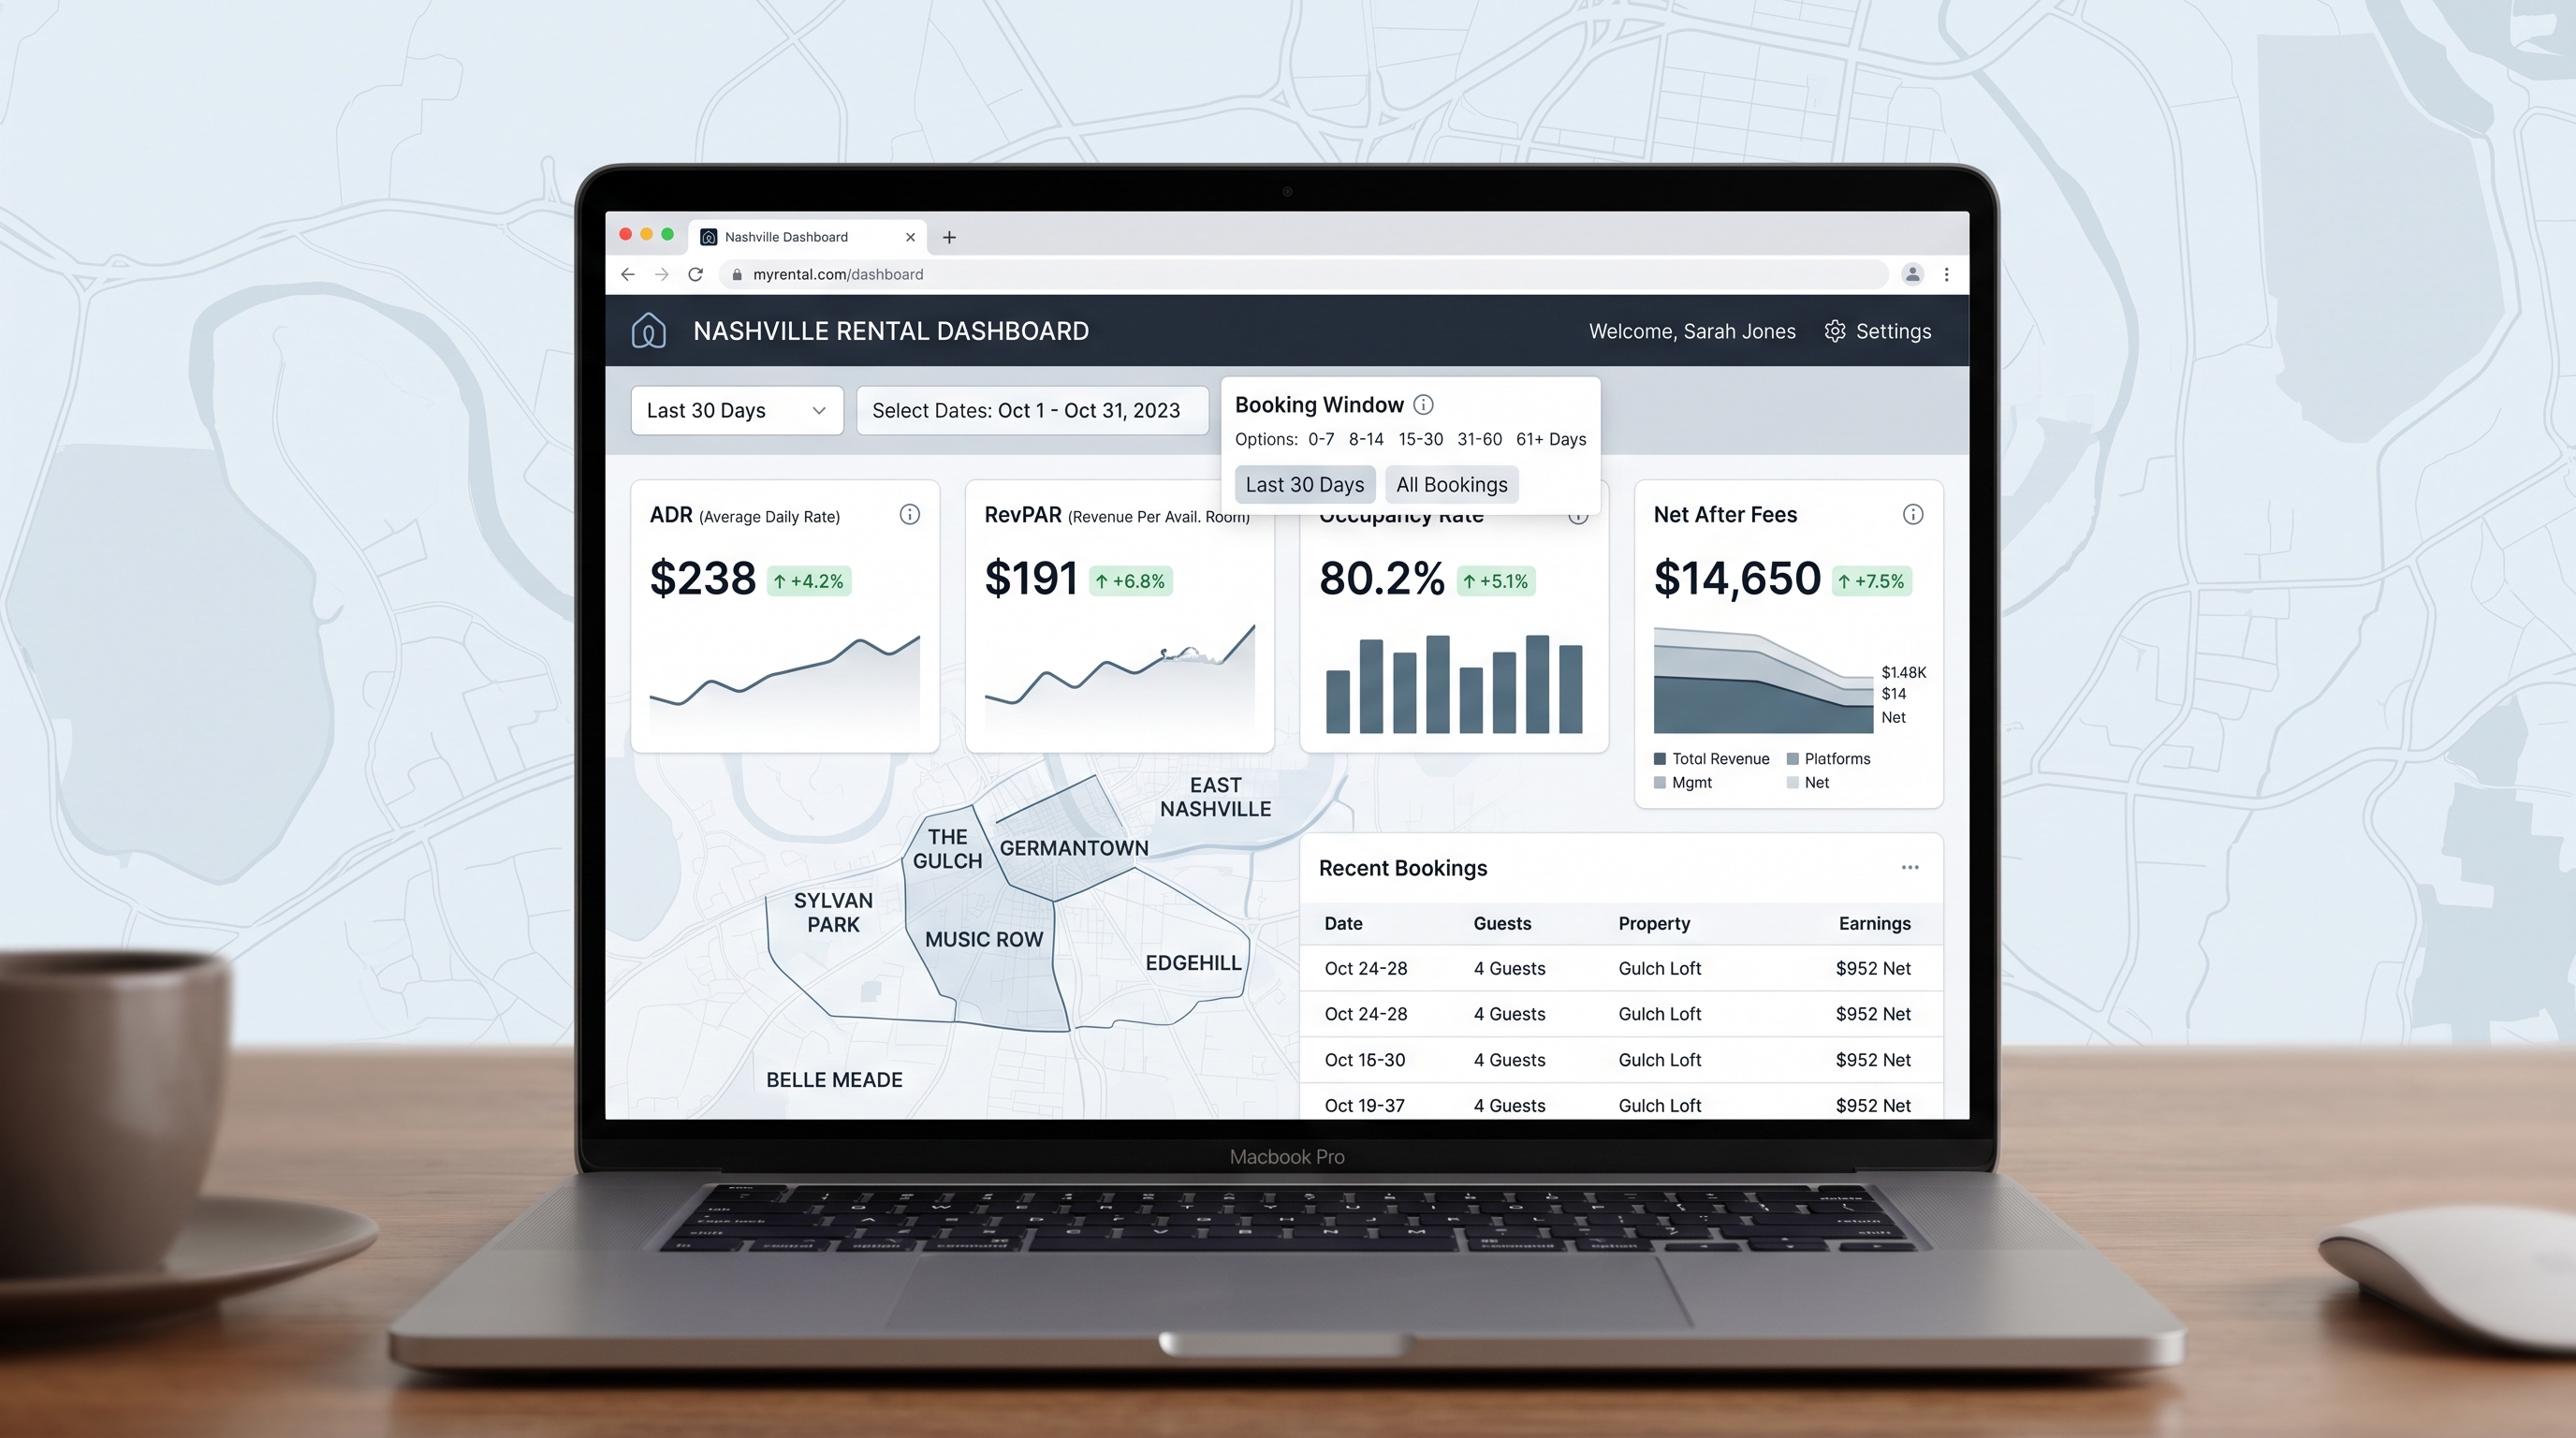
Late August in Nashville can trick owners. Weekend groups still book, but midweeks soften before Labor Day and Titans home games lift September. If your dashboard only flaunts gross revenue, you will miss where profit leaks. The right airbnb owner reporting metrics make late-summer variance obvious, and they tell you exactly which lever to pull next month.
- Quick take: Track ADR, occupancy, RevPAR, and net after all fees by booking window, not just by month.
- Audit your owner statement line by line. Hidden fees and pass-throughs often erase apparent gains.
- Compare performance by neighborhood and bedroom count, not citywide averages.
- Build alerts for margin compression, like rising cleaning cost per stay or falling RevPAR inside 0 to 14 days.
- Judge managers and tools by reporting transparency, not pretty charts.
What Airbnb owner reporting metrics matter most each month
Most owners get a monthly Airbnb revenue report that highlights gross booking revenue. Useful, but incomplete. Your dashboard should surface these operator-grade metrics every month, with a toggle for both the whole month and for key booking windows like 0 to 14, 15 to 30, and 31 to 60 days out.
- ADR (average daily rate): total lodging revenue divided by paid nights. Anchor it by bedroom count. AirDNA reports a 2026 citywide ADR near $362.3, but your 3 bedroom in The Nations should not be compared to a studio in Downtown. Source.
- Occupancy: paid nights divided by available nights. For airbnb occupancy rate meaning, ignore blocked owner nights. AirDNA shows about 54 percent citywide for 2026, which masks spikes during event weeks and softer shoulders.
- RevPAR: revenue per available night. Use both formulas, total lodging revenue divided by available nights, and ADR multiplied by occupancy. AirDNA lists Nashville RevPAR around $185.8 in 2026, a cleaner compare than raw occupancy. Source.
- Net after fees: distributable income to you after platform commissions, cleaning payouts, taxes, management fees, maintenance reserves, and supplies. This is the number your bank account feels.
- Booking window mix: how many paid nights booked 0 to 14 days before check in, 15 to 30, and 31 to 60. Nashville skews to short-notice weekend groups in late summer, then football and fall events lengthen windows.
- Length of stay: average nights per reservation. Short stays raise cleaning and restock cost per occupied night.
- Cleaning cost per stay and per occupied night: service quality matters, but unmanaged pass-throughs will crush margins in high-turnover months.
- Channel mix and effective commission: Airbnb, Vrbo, direct. Weighted average commission tells you if net is improving as mix shifts.
When a dashboard rolls these into a single panel, you see cause and effect. If ADR held, but RevPAR slipped, occupancy fell or fees crept. If RevPAR rose but net fell, expenses expanded faster than rate gains. That is how an operator reads the page.
How to read an Airbnb owner statement without missing fees
Gross booking volume is the start. Your statement should reconcile every dollar from guest payment to owner distribution. Here is what to scan every month.
- Gross lodging revenue: room rate component only. Separate out cleaning fees charged to guests.
- Platform commissions: Airbnb or Vrbo host fees. Confirm the rate and whether taxes are included or excluded from the commission base.
- Cleaning payouts: what was paid to cleaners versus what the guest paid. Look for markups or emergency turn charges. Track average cleaning cost per stay.
- Taxes: local and state occupancy or sales tax amounts collected and remitted. Verify totals against reservations. Tax variance is a common source of mismatch.
- Refunds and adjustments: partial refunds for issues, host cancellations, or resolution center credits. They often sit on a separate line and quietly erode the month.
- Management fee: confirm the percentage and whether it is calculated on gross lodging, lodging plus cleaning, or net of commissions. Small base changes have big net effects.
- Maintenance and supplies: broken items, restocks, consumables. Track spend per occupied night.
- Owner usage blocks: nights you blocked. They reduce available nights and distort ADR and occupancy if not accounted for.
- Net owner distribution: the number that hits your account. Save it to a tracking sheet so you can compute net margin percentage over time.
Example, a Downtown 2 bedroom in August:
- Gross lodging revenue: $10,800
- Airbnb commission: $540
- Guest-paid cleaning fees: $1,200
- Cleaner payouts: $1,360
- Taxes withheld and remitted: $1,047
- Management fee, 18 percent of lodging: $1,944
- Maintenance and supplies: $220
- Net owner distribution: $10,800 minus $540 minus $1,360 minus $1,944 minus $220 equals $6,736, before taxes if you remit directly
If your statement format makes this math hard to follow, you are flying blind. If you also need a refresher on whether professional management pencils out at scale, read our analysis, Is Nashville Vacation Rental Management Worth It in 2026.
What is RevPAR in short term rental reporting
Operators get this wrong because they compare occupancy screenshots without context. What is RevPAR short term rental definition in practice: total lodging revenue divided by available nights, or ADR multiplied by occupancy. Both routes should match.
Two examples from the same month tell the story:
- Germantown 3 bedroom, ADR $420, occupancy 62 percent, RevPAR $260.4.
- 12 South 3 bedroom, ADR $470, occupancy 55 percent, RevPAR $258.5.
Occupancy alone favors Germantown, ADR alone favors 12 South, RevPAR shows they are nearly tied. To decide where you are winning, compare net after fees next, because cleaner payouts and maintenance patterns can differ by neighborhood and home type.
Pro tip: track RevPAR by booking window. If 0 to 14 days RevPAR is sagging while 31 to 60 is solid, you have a last minute pricing problem, not a product problem.
Want to see what your property could earn? Use our free Nashville STR Revenue Calculator to get a personalized forecast.
Gross vs net Airbnb revenue, what owners should compare
Here is how a month can look healthy on top line but weak on distribution.
- Month A: Gross lodging $12,000, ADR $400, occupancy 60 percent, RevPAR $240. Expenses steady, net distribution $7,900. Net margin 65.8 percent.
- Month B: Gross lodging $13,400, ADR $420, occupancy 64 percent, RevPAR $268. Cleaning payouts rose due to 1 night stays and emergency turns. Platform mix shifted to higher-fee channels. Net distribution $7,600. Net margin 56.7 percent.
Top line is higher in Month B, but you kept less. Always compare gross vs net Airbnb revenue side by side with net margin percentage. Add two sanity checks:
- Cleaning cost per occupied night: total cleaning paid divided by paid nights. If it jumps, review minimum stays and turnover scheduling.
- Effective commission: total commissions paid divided by gross lodging. If it climbs, your channel mix is hurting net.
On your statement, label guest-paid cleaning fees clearly. If a manager assesses a cleaning surcharge beyond the vendor invoice, it belongs in your management section, not hidden under pass-throughs.
How to use a STR performance dashboard to spot margin loss
A strong str performance dashboard is not a poster of last month. It is a workflow. Build these views and set alerts so you act before margin disappears.
- Booking window board: 0 to 14, 15 to 30, 31 to 60 days. Show ADR, occupancy, and RevPAR for each window, plus last 4 weeks of trend. In late August, 0 to 14 should be your focus. If occupancy is below 45 percent inside 10 days, cut rates and drop two-night minimums Sunday to Thursday.
- Length of stay and cleaning burden: a tile that shows average stay length and cleaning cost per occupied night. If average stay drops from 3.2 to 2.1 nights, expect cleaning cost per occupied night to spike. Adjust minimum stays and offer 3 night discounts.
- Fee variance watch: month over month changes in platform commissions, refunds, and resolution payouts. Anything over plus 10 percent without a volume change gets a note and review.
- Event compression tracker: tag event weeks. ADR may be high, but if pickup inside 7 days is flat, your base rates are overshooting. Use a 10 to 15 percent rollback for Sundays and Thursdays post-event.
- Channel mix tile: Airbnb, Vrbo, direct. Show effective commission and RevPAR by channel. Feed this back into your ad spend or promotions.
- Neighborhood compare: RevPAR by bedroom count for Germantown, The Gulch, East Nashville, and The Nations. It keeps you honest when averages drift citywide.
Automation matters. Your dashboard should email you if 0 to 14 day RevPAR falls 15 percent week over week, or if cleaning cost per occupied night breaches your target. With 11,000 active listings in the metro as of 2026, per BNBCalc, small misses do not fix themselves. Source.
Which monthly KPI should trigger a pricing or operations change
Pick thresholds now so you do not debate later.
- 0 to 14 day occupancy below 50 percent: issue yield actions. Lower price floors, relax minimum stays, and recheck lead photo and title quality. If you need a diagnostic primer, see our guide, East Side To Gulch, Why Is My Nashville Airbnb Not Getting Booked.
- RevPAR down 10 percent year over year for the same month: verify comp set and listing changes. If comps held flat, your rate strategy or reviews slipped.
- Cleaning cost per occupied night up 15 percent: enforce longer minimum stays on high-cleaning-cost unit types, bundle midweek discounts, and audit vendor billing.
- Effective commission up 2 points: push direct booking offers to repeat guests, or rebalance promotions between channels.
- Refunds over 1.5 percent of lodging: read message threads and maintenance logs. Quality issues are burning cash.
One note on rules. If you are not legally permitted for the way you operate, none of these optimizations matter. For a no-drama overview, start here: From Permit to Five-Star: Running a Compliant, Automated Nashville Airbnb in 2026.
How to review reporting by neighborhood and booking window
Citywide averages hide the swings that matter. AirDNA puts 2026 Nashville revenue per listing near $41.3K with occupancy near 54 percent and ADR around $362.3. Those are baselines, not targets, and they vary by bedroom count and submarket. Source.
- Germantown: midweek demand is steadier due to proximity to Downtown offices and venues. Expect slightly lower occupancy in August, but better shoulder midweeks in September and October. Track 31 to 60 day pickup for conference weeks.
- The Gulch: premium ADR, but guests are choosy. Monitor photo click-through and conversion. A small ADR cut inside 7 days can save the month without cheapening weekends.
- East Nashville: weekend group demand leads. Watch 15 to 30 day windows for bachelorette pickup. If it stalls, enhance group-friendly amenities in the listing copy and adjust pricing curves Friday and Saturday.
- The Nations: families and small groups, strong value play. Keep cleaning cost per stay tight and emphasize parking and space. Offer third-night discounts to lift length of stay.
- Donelson: airport convenience. Same-day bookings are common. Your last minute rate guardrails matter more than top-of-funnel marketing here.
Build a comp set for each property by neighborhood and bedroom count. Then chart monthly RevPAR versus that comp set and chart net margin percentage. The first tells you about pricing and demand. The second tells you what you actually keep. If you want more context on whether management increases or decreases returns in practice, read, Is Nashville Vacation Rental Management Worth It in 2026.
What are the most important Airbnb owner reporting metrics?
Track ADR, occupancy, RevPAR, and net after all fees every month, plus booking window mix and cleaning cost per stay. Those airbnb owner reporting metrics together explain why a month outperformed or lagged. Add effective commission and refunds so you catch margin compression before it hits your payout.
How do I read an Airbnb owner statement?
Follow the money from guest payment to owner distribution. Start with gross lodging, subtract platform commissions, cleaning payouts, management fees, taxes, maintenance, and refunds, then confirm the net that hits your account. If any category is bundled, ask for a breakout so you can compute net margin percentage and spot fee creep.
What is RevPAR in a short-term rental?
RevPAR is revenue per available night. Compute it as total lodging revenue divided by available nights, or ADR multiplied by occupancy. It is the fastest way to compare listings or months because it bakes in both rate and occupancy instead of pitting them against each other.
What is the difference between gross and net Airbnb revenue?
Gross is what guests paid for lodging before deductions. Net is what you keep after commissions, cleaning payouts, management fees, taxes, maintenance, and refunds. Track net margin percentage so months with higher top line but lower distribution are easy to flag.
How do I know if my Airbnb dashboard is misleading?
If it highlights gross revenue without showing net after fees, booking window breakdown, and cleaning cost per stay, it is incomplete. Another red flag is citywide averages without neighborhood and bedroom segmentation. Ask for RevPAR, effective commission, and refund rates on the same screen.
How often should I review my Airbnb performance dashboard?
Review weekly for 0 to 14 day windows and monthly for full-month reconciliation. During event seasons or when pickup stalls, check daily for last minute windows and set alerts for RevPAR drops and fee spikes. Quarterly, audit net margin trends and comp set alignment.
Which Airbnb metric matters most, ADR, occupancy, or RevPAR?
RevPAR is the best single metric because it blends ADR and occupancy. That said, net after fees is what pays the mortgage, so pair RevPAR with net margin percentage to avoid celebrating months that looked great on rate or occupancy but delivered weak distributions.
If you are serious about improving next month, get numbers you can act on. Get your free Nashville revenue estimate, then Schedule a consult to see how Misfit Homes builds dashboards that protect your margin and your time.
Related: See more Nashville STR insights | Explore how we run operations.
Next step
If you want a risk-aware plan for permits, pricing, and operations in Nashville, I’ll walk you through it quickly and candidly.
Thank you for reading!
Farewell!