How to Read Nashville Airbnb Revenue After a 20% Supply Drop
Nashville Airbnb revenue rose as supply fell. Learn how to compare occupancy, ADR, and RevPAR before investing or expanding with a proven Nashville team.
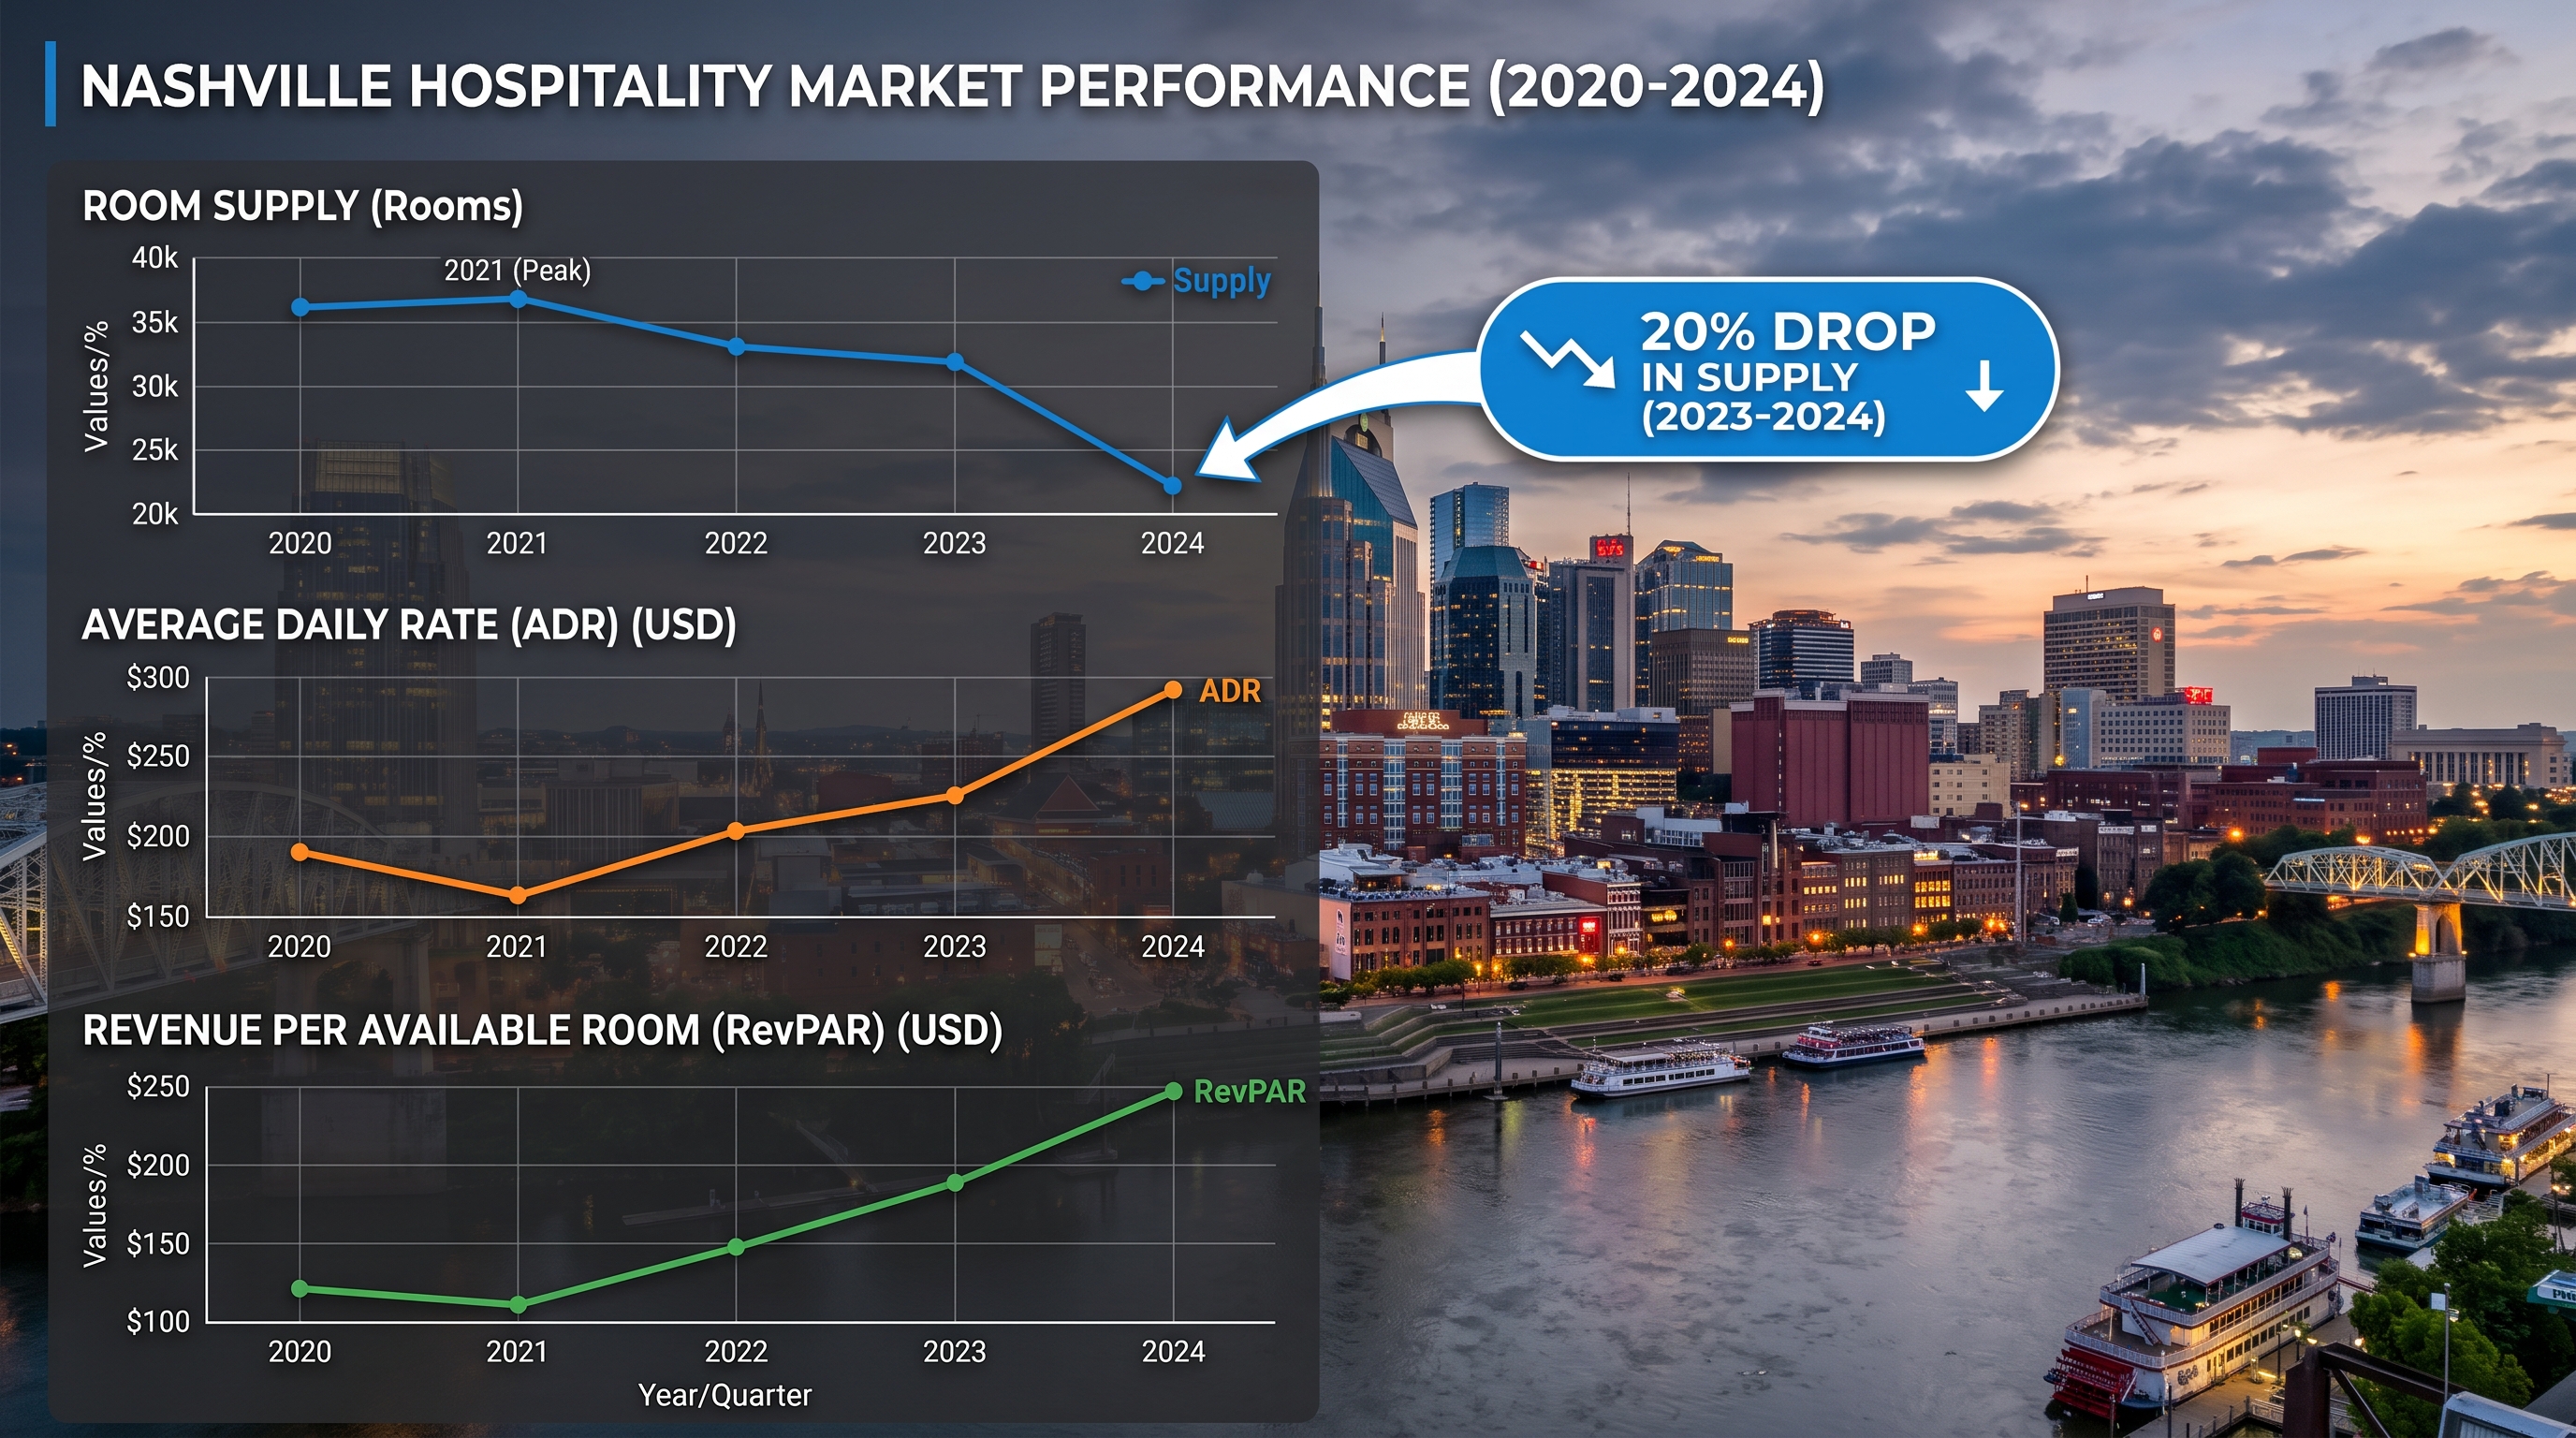
Active listings shrank, headlines say revenue is back, and owners are asking what is real. Here is the clean read: Nashville’s listing count fell hard, and averages moved in ways that can mislead. If you care about Nashville Airbnb revenue, judge occupancy, ADR, and RevPAR together, not one metric in isolation.
- Quick take: Separate supply from demand. A smaller market can lift per-listing averages without true demand growth.
- Use RevPAR as your anchor metric, then cross-check ADR and occupancy to spot illusions.
- Benchmark against tight neighborhood comps by bedroom count and amenity set, not citywide means.
- Underwrite with conservative ADR, realistic occupancy, and a booking-window plan for events.
- Decide with math, not headlines. Build a deal model that survives flat RevPAR.
What Nashville Airbnb revenue data shows after the supply decline
AirDNA reports that from September 2025 to September 2026, Nashville active listings fell 19.9%, while average revenue per listing rose 47.0%. In the same window, ADR declined 15.3% and RevPAR slipped 0.9% (AirDNA, September 2026). That mix says the quiet part out loud: with fewer listings in the pool, the average revenue per active listing can rise even when unit-level pricing power and revenue per available night are flat to down.
For context, AirDNA’s May 2026 snapshot showed roughly 54% average occupancy and about $40.5K average annual revenue per listing, with revenue down 7.1% year over year and ADR down 5.4% year over year (AirDNA, May 2026). These are two different time frames that paint a consistent picture of pressure on pricing, plus churn in the supply base. Treat the 19.9% Nashville Airbnb supply decline as a first-order driver of the rebound you see in per-listing revenue averages.
Tourism fundamentals are still solid. Davidson County generated $11.6 billion in visitor spending in 2025, with momentum forecast to grow further (source: Visit Music City). But tourism growth alone does not explain a 47% jump in per-listing revenue alongside falling ADR and flat RevPAR. Supply contraction and selection effects do.
Why Nashville Airbnb occupancy can rise while RevPAR falls
RevPAR is Revenue per Available Rental night. It is calculated as ADR multiplied by occupancy. If discounting pulls rates down faster than nights fill in, RevPAR falls even if occupancy ticks up. That is why a higher Nashville Airbnb occupancy rate does not automatically mean stronger returns.
Example: your comp set last year averaged $350 ADR at 55% occupancy, which is $192.50 RevPAR. This year, average pricing drops to $300 ADR but occupancy lifts to 58%. RevPAR is now $174. That is a 9.6% decline even though you sold more nights. If your top-line revenue still rose, odds are the property stayed active while lower-performing listings exited, or you lengthened stays and weekends to capture more nights without gaining true pricing power.
The September 2025 to September 2026 data aligns with this math. ADR eased, RevPAR edged lower, yet per-listing revenue rose because there were fewer listings competing. That is not a blanket green light to buy any deal or to assume automatic growth.
Want these numbers for your home?
Send us the address or your last 12 months of statements. We will show you where it sits against the market and what we would change.
How to compare Nashville Airbnb ADR, occupancy, and RevPAR
To make a fair call on performance, force these three metrics to agree with each other. One of them lying to you is what blows underwriting.
Step 1: Build a tight comp set
Use 10 to 20 active comps within 0.5 to 1.0 miles, same bedroom count, similar guest capacity, and comparable features: dedicated parking, rooftop, walkability to The Gulch or Broadway, or proximity to Five Points in East Nashville. Exclude outliers with unusual minimum stays or obvious design disadvantages. If your home is a 3 bedroom townhome in The Nations with a rooftop, do not mix it with 2 bedroom condos in Midtown.
Step 2: Pull ADR, occupancy, and RevPAR for the same dates
Compare your Nashville Airbnb ADR, occupancy, and Nashville Airbnb RevPAR to the comp averages for the same trailing 90 and 365 days. If your ADR is 10% above comps but occupancy is 15% below, you are overpricing. If ADR lags 10% but occupancy is only 3% higher, you are leaving money on the table. RevPAR should reconcile the tradeoff.
Step 3: Read the booking window
Look at days-to-book by day of week. In Downtown and The Gulch, weekends can close inside 14 days. In Donelson and Madison, weekdays may need longer lead time and value pricing. If you are waiting too long to fill weekdays, raise weekend ADR and lower midweek prices earlier. Your RevPAR target improves without chasing occupancy at any price.
Step 4: Watch length of stay and shoulder nights
Longer stays can lift top line by cutting cleaning gaps, but average nightly price often falls. Track RevPAR by stay length and whether Thursdays and Sundays are filling. A property that wins shoulder nights at a small ADR discount usually beats a place that only sells Fridays and Saturdays at a premium.
Step 5: Inspect channel mix and calendar health
Blocked dates and maintenance holds crush RevPAR. So does a calendar that stays closed for cleaning an extra day. Measure available nights versus total nights, and check where bookings originate. If a listing is 90% reliant on one channel, your pricing data may not reflect the wider market.
Want to see what your property could earn? Use our free Nashville STR Revenue Calculator to get a personalized forecast.
Is Nashville’s smaller STR market creating a revenue illusion?
It can. When lower-performing listings churn out, the remaining pool looks stronger on average. AirDNA’s September 2026 cut shows per-listing revenue up sharply while ADR and RevPAR softened. That pattern is consistent with selection effects, not a demand surge.
Industry research also points to rate-driven math rather than demand growth. Analysts at AirROI flagged that national STR revenue growth in 2026 skewed toward rate and mix effects with demand largely flat. Locally, owners who held quality inventory, tuned pricing faster, and captured high-demand weekends fared better than citywide averages, especially in guest-favorite clusters like The Gulch, Germantown, and walkable East Nashville pockets near Five Points.
Events still matter, but not evenly. Music festivals, NFL home games, and destination races create short booking windows that reward clean operations and fast repricing. If your calendar and housekeeping cannot flex, you will miss these spikes even when the market is healthy. That is one reason professional teams can out-earn similar homes a few blocks away.
How to benchmark a property against Nashville short-term rental market trends
Use the city averages as guardrails, then build your own truth at the property level. Here is a repeatable process that works across The Nations, Wedgewood-Houston, and Downtown alike.
- Start with the city baseline. AirDNA, May 2026 showed about 54% occupancy and about $40.5K average annual revenue, with revenue and ADR down year over year. Treat this as a floor for underwriting, not a promise.
- Layer in near-neighbor comps. Pull 10 to 20 comps within your micro-area and identical bedroom count. Segment by group-friendly amenities like rooftop decks, parking, and number of real beds. If your place sleeps eight adults in three closed bedrooms, compare to the same, not to 2 bedroom lofts.
- Score design and photography. Listings with clean, modern design and pro photography often support 5 to 10% higher ADR in walkable areas. If your finish level lags Germantown or 12 South standards, expect to price under comps to maintain occupancy.
- Index your calendar behavior. Compare your minimum stays, check-in restrictions, and how often you close for maintenance or personal use. Availability losses drag RevPAR more than most owners realize.
- Run a RevPAR index. Divide your property’s RevPAR by the comp average. Under 0.90 means you are trailing, 0.90 to 1.05 is competitive, over 1.05 signals pricing power. This is the cleanest single number to track over time.
- Cross-check with booking pace. Are your next 30, 60, and 90 days pacing ahead or behind comps by weekday and weekend? Pacing data catches issues weeks earlier than a monthly P&L.
If you want a broader strategy lens on returns and operations, read our investor guide, Nashville STR Comeback Play, and our practical framework in Nashville Airbnb Investment Playbook 2026. Both outline how to use data and disciplined pricing rather than chase city averages.
What supply contraction means for Nashville Airbnb investment returns
Supply contraction can be positive for well-run assets, but it raises the bar for underwriting. Here is how to analyze Airbnb investment returns without getting tricked by averages.
Underwrite RevPAR first, not revenue
Start with a conservative RevPAR based on your comp set, then map ADR and occupancy scenarios that produce it. If comps average $175 RevPAR, model a base case at 95% of that, a downside at 85%, and an upside at 105%. Check that your mortgage, taxes, insurance, utilities, and cleaning still pencil under the downside.
Control ADR realism
With ADR down year over year in both the May 2026 and September 2026 views, avoid building a pro forma on rate growth. Instead, plan to earn modest ADR outperformance via design upgrades, pro photography, smarter minimum-stay rules, and better booking window management.
Respect occupancy ceilings by submarket
Broadway-adjacent condos and The Gulch townhomes can maintain healthy weekend sell-through, but midweek softness is real. In Donelson, proximity to the airport can help weekdays, while weekend tourist pull is weaker than Downtown. Right-size occupancy by day type, then test whether slight ADR cuts on Sundays and Thursdays lift total RevPAR.
Align property type with demand
Group-friendly layouts, 3 to 4 bedrooms with real beds and parking, often monetize event weekends better than studios and 1 bedrooms in non-walkable areas. That can protect RevPAR when ADR trends are soft. If you are deciding between a 2 bedroom and a 3 bedroom in The Nations at similar price per square foot, the 3 bedroom often gives better RevPAR resilience.
Plan for event surges, then ignore them in base math
Do not let one festival or a stadium weekend carry your underwriting. Use events as opportunistic upside. Build your base case on shoulder months and regular weekends. Then add a light kicker for events based on recent booking windows and what you can actually capture with your operations team.
Once you have your return model, compare it to your goals for cash-on-cash and payback. A clean model that clears your hurdle on flat RevPAR is safer than a rosy model that needs 10% ADR growth to work. If you want a deeper operations lens to execute the plan, our playbook, 2026 Guide to Nashville Vacation Rental Management Success, is a strong next read.
Neighborhood signals to watch without overfitting
Do not chase micro-trends that you cannot reproduce. Watch these signals instead.
- Walkability premiums. Near The Gulch and Downtown, true walk-to-dining access still commands higher ADR even when rates soften. Verify that premium with your comp set rather than assume a number.
- Parking and group capacity. In Germantown, Wedgewood-Houston, and The Nations, 1 garage spot plus street parking can be the difference between winning and losing a 6 to 8 person group booking.
- Design parity. East Nashville guests respond to distinct style, not generic mid-century replicas. If your listing photos do not stand out in the first 6 tiles, expect to discount to hit occupancy.
- Channel mix. If a pocket is dominated by one platform, you need rate discipline and messaging polish to avoid race-to-the-bottom pricing. The healthiest comp sets convert across multiple channels.
Owner expectations in a shrinking market
A smaller active pool rewards sharp execution and punishes sloppiness. Calendar health, professional photography, consistent cleaning turn times, and proactive minimum-stay adjustments matter more when ADR is under pressure. The owner who reads pacing weekly and adjusts for booking windows will outperform the owner who waits for a monthly statement to notice problems.
For straight talk on how this translates to your home, we have managed Nashville STRs since 2017 and currently manage 78 homes. The pattern is consistent across neighborhoods: the gap between market conditions and property execution creates most of the spread you see in results.
Why is Nashville Airbnb revenue increasing?
AirDNA shows that from September 2025 to September 2026, average revenue per active listing rose while ADR and RevPAR slipped. The jump is largely a supply story, with 19.9% fewer active listings lifting averages for those still operating. True demand strength shows up in stable or rising RevPAR, not just in higher per-listing totals.
What is the average Airbnb occupancy rate in Nashville?
AirDNA’s May 2026 snapshot reported roughly 54% average occupancy citywide. Treat that as a directional baseline, not a target for your property. Benchmark against a tight comp set by bedroom count and neighborhood to set realistic goals.
What is a good Airbnb RevPAR in Nashville?
There is no single good number because RevPAR depends on bedroom count, location, and design quality. Start by calculating a comp average for your micro-area, then aim to run at or slightly above that level through pricing and availability tactics. A RevPAR index over 1.00 versus your comp set means you are beating like-for-like peers.
Is Nashville still a good market for short-term rental investment?
Yes, with discipline. Visitor spending remains strong per Visit Music City, but ADR pressure and flat RevPAR in recent AirDNA cuts mean you must buy right and operate well. Underwrite on conservative ADR and realistic occupancy, then plan to win through execution rather than market lift.
How does Airbnb supply affect revenue in Nashville?
Fewer active listings reduce competition, which can raise average revenue per active listing even if pricing power is soft. That said, supply contraction does not automatically raise your RevPAR. You still have to capture demand with sharp pricing, availability, and operations.
Should investors trust average Nashville Airbnb revenue figures?
Use them as guardrails, not gospel. Averages can rise when weak listings churn out, which inflates the surviving pool. Judge your deal against a comp set and focus on RevPAR and net operating results rather than average Nashville Airbnb revenue alone.
How do you calculate Airbnb RevPAR and evaluate a property?
RevPAR is ADR multiplied by occupancy. Pull ADR and occupancy for your comp set and for your property over matching dates, compute RevPAR, then create an index versus comps. Layer in booking pace, length of stay, and availability losses to find the levers that will move your result.
Ready to make a data-backed move? Get your free Nashville revenue estimate or Schedule a call to review your comp set and forecast one on one.
Questions about your Nashville rental?
Misfit Homes has managed short-term rentals in Nashville since 2017 and runs 78 homes here today. Book 15 minutes with Steve, or call or text.
Related Resources
Thinking about hiring a manager? Misfit Homes is a founder-led Nashville Airbnb management company, and we keep an honest list of the best Airbnb management companies in Nashville, ranked, with ourselves third on it.